US News and World Report - Top Hospitals is a GREAT resource for people who are searching for Top Hospitals, but tough for hospitals who want to understand the methodology and why they aren't ranking better. I created this Dashboard to help hospitals understand the basic methodology and what improvements they need to make to improve their rankings.
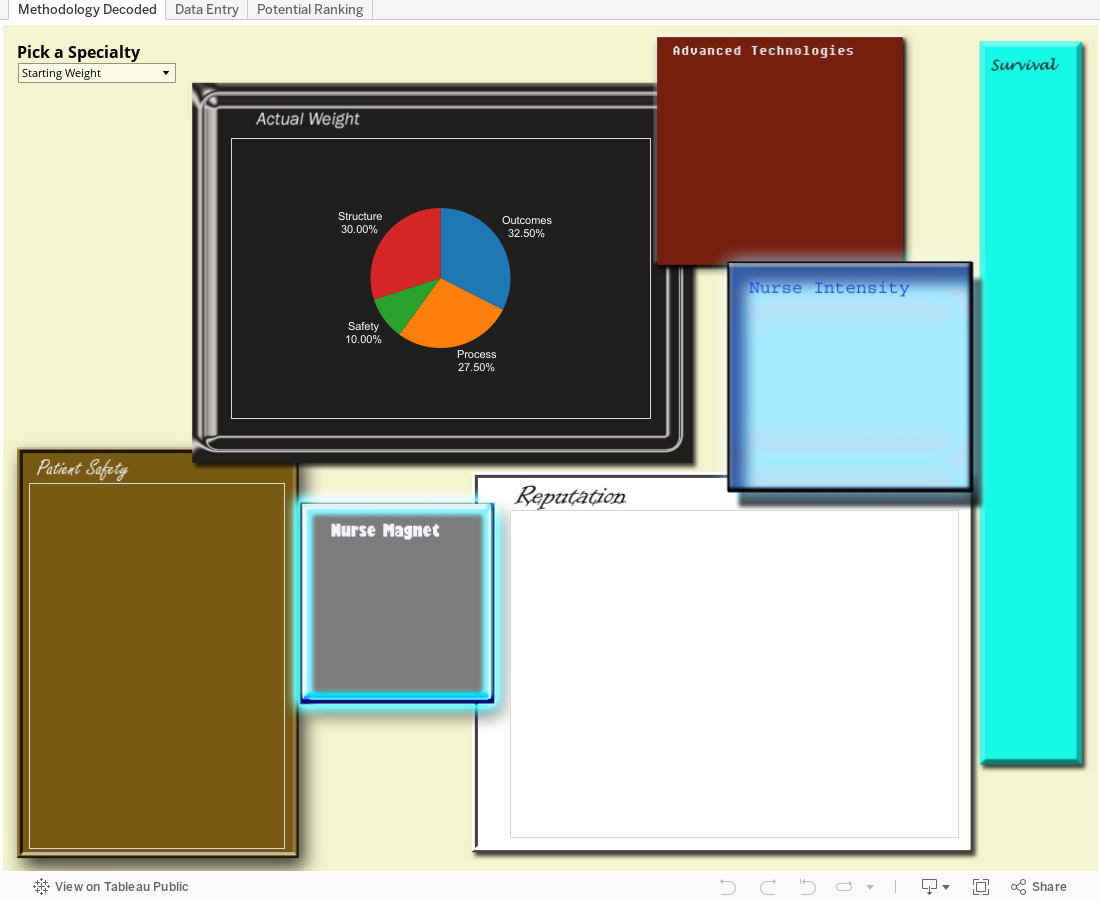
Most hospitals believe (wrongly) that to get into the top 50 they have to improve their Reputation (Process) score since it makes up 27.5% of the total score. The weight of the Process score is determined by the highest Process score received by a hospital in a particular specialty. Example: if the highest Process score in a specialty is 65, then the Process weight is 17.8% (27.5 X 65%). The remaining 9.7% is then distributed among the other areas (Outcomes, Safety and Structure).
In the Methodology Decoded tab I show the Actual Weight by Specialty for the 2014-2015 report. Use the Pick a Specialty drop-down menu to see how the weights vary. I also included some statistics for the most common components in each measure.
Now... if you are interested in doing more analysis then go to the Data Entry tab and enter the component totals for your hospital (they can be found on the US News and World Report Top Hospitals website. Simply search for your hospital and click on a specialty.) Since many of components (like Patient Safety) are used in multiple measures, I made it so you only have to enter the number once (the dashboard knows which components are in each specialty.) I did not include the Process (Reputation) score since Reputation is subjective and difficult to improve (and not my area of expertise.) Enter totals for just the specialties you are interested in or all of them. Now go to the Potential Ranking tab and start playing around w/ the numbers. You can easily see how improving one component (such as Patient Safety) affects multiple specialties and improves your ranking.
Enjoy...